According to the DB-Engines website, Apache Solr, is the second most popular search engine software in use today. Since Solr is written in Java, performance will obviously be impacted by which JVM you use.
Recently, here at Azul we decided to compare the performance of Solr running on Zing using C4 to Oracle’s Hotspot JVM using G1 for garbage collection. To do this, we worked with one of our customers who runs Solr on 200 production nodes. They also use a good size data set of 20Tb, which would provide a realistic comparison between the two JVMs.
To make things fair, the tests were run on paired workloads using identical configurations. The configurations were:
- Full-text search on a machine with 32Gb RAM configured for a 16Gb JVM heap.
- Metadata search on a machine with 8Gb RAM configured for a 4Gb JVM heap.
As I’ve said before, people sometimes think that because Zing can scale all the way up to a heap of 2Tb that it must need bigger heaps to work efficiently. This is definitely not the case; using a 4Gb heap for the second set of tests is certainly not big by today’s standards.
The tests being run were not artificially created benchmarks, but an evaluation of how a real production system works. You can’t really get a better test scenario than that when evaluating performance.
Again, to ensure fairness and to eliminate any short-term effects on the systems they were both run for forty-eight hours. We wanted to make sure that we would see any long term trends in our data.
To assess the performance of each JVM we used jHiccup to measure the latency associated with the JVM whilst running the tests. jHiccup is a great tool for this because it runs in the same JVM running the code under test but does not interact directly with the application code. jHiccup measures the latency that is observed by the application caused by everything that is not the application itself; i.e. the JVM, the operating system and the physical hardware. Because we’re running the same application code on identical hardware, any differences in observed latency will be purely down to differences in the way the JVMs work internally. You can find out more information about jHiccup here.
I don’t think it’s an understatement to say that the results were conclusive that Zing performs significantly better in this scenario. The graphs that follow show the latency associated with Hotspot using the G1 garbage collector on the left and Zing using the C4 collector on the right.
For the full-text tests we got these results:

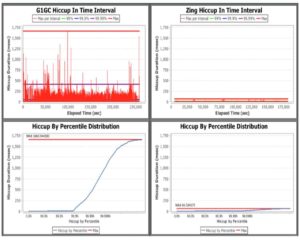
The maximum pause time for Oracle’s JVM was 1667ms, and for Zing it was 67ms. Even taking out most of the outliers from Hotspot (and why would you since this will impact your performance) it’s clear from the graph that Hotspot’s latency is consistently about 250ms.
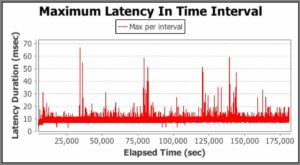
With the scale of the graph it’s hard to tell for Zing, so let’s look at the graph scaled to the values recorded.

Doing this we can see that with Zing the observed latency is consistently 15-20ms. From our observations of Zing on other workloads and doing further analysis we can say that 10ms of that latency is from the OS and hardware not the JVM. This is consistent with the operating system having a small number of cores and many threads (so lots of context switching involved).
For the second, metadata search test, we geot these results:

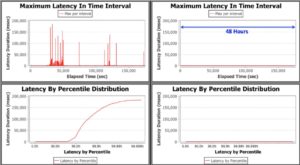
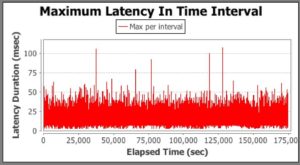
In this case, the maximum latency for Hotspot was a massive 184, 684ms (that’s over three minutes!) compared to Zing with a maximum latency of 107ms.
Again, scaling the Zing graph to see the data more clearly we get this.

It’s said a picture is worth a thousand words and I think these graphs really speak for themselves.
If you’re using Apache Solr (or Elasticsearch, which is also based on Apache Lucene and therefore Java-based) why not give Zing a try? You can download a free 30-day trial here.


