
Today’s modern, containerized, elastically scaling Java clusters often rely on CPU utilization as the main trigger for scaling out new instances. Imperfect as this metric may be, it is ubiquitous to scale out new instances based on CPU utilization going over some limit. Often that limit is surprisingly low, somewhere around 40 to 50%.
Azul Platform Prime replaces OpenJDK’s HotSpot C2 compiler with the Falcon JIT compiler. Falcon generates much faster code than OpenJDK, allowing you to handle more transactions in a container before hitting your CPU utilization limit. Prime’s smoother and more consistent execution also allows you to safely raise your CPU utilization to 60-70%, resulting in massive gains in carrying capacity for each container and lower overall cloud costs to handle your total Java workload.
One recurring problem, however, is balancing CPU-based autoscaling with the larger CPU requirements of the Falcon JIT compiler during the warmup phase of the JVM. Many autoscalers give a JVM a short grace period to warm up (usually about 1-2 minutes), then start monitoring the JVM with health checks. If, after 1-2 minutes, the CPU is over e.g. 50%, they scale out more machines. But if JIT compilation hasn’t settled down by that point, it’s possible you are scaling more instances for nothing, since the CPU utilization isn’t high due to traffic but due to JIT compilation, which will soon subside. This can cause your cluster to get stuck in a loop, where it constantly spins up new machines, thinks they are backlogged, then spins up more, and so on.
In this article, we examine Azul Platform Prime’s strategies for balancing JIT compilation CPU overhead with CPU-based autoscaling in order to deliver the maximum performance without these scaling headaches. Here’s a teaser of what the before and after looks like. Let’s check it out step-by-step.

Starting the journey
Let’s use the previously mentioned scenario: Start the Java workload, set 1 minute as the threshold for the JVM to stabilize the performance/CPU utilization (so-called post-warmup phase), and after 1 minute, activate the autoscaler to scale up if the CPU utilization goes above a certain threshold (e.g. 50%). As operators of the JVM, we can’t control how much CPU the application itself consumes (it depends on the load). The goal is therefore to control the CPU consumed by the JIT compiler in the post-warmup phase to ensure that we’re scaling because of increased load, not due to JIT activity.
Consider the following chart that depicts the CPU utilization by the compiler for a Java workload.
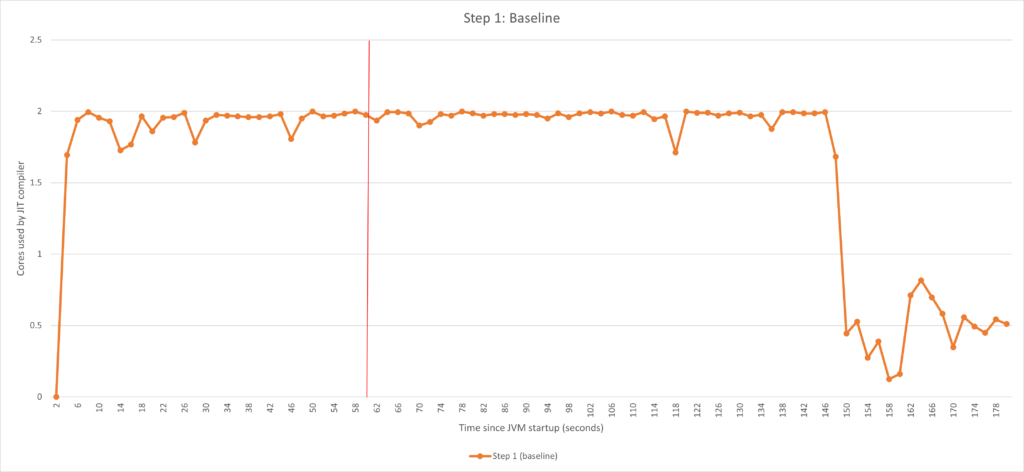
We can see from the chart that the compiler is still very active after our 1 minute (60 seconds) mark. This is because there are possible methods that had not yet reached the compile threshold or because the compiler queue was backed up by the initial burst of activity.
In order to achieve our goal (minimize JIT compiler activity after 60 seconds), the main strategy is as follows:
- Establish the baseline.
- Use ReadyNow to front-load as many optimizations as possible early in the run. With ReadyNow, we already know which optimizations are needed and can start doing them even before the methods are called for the first time, rather than waiting for them to reach the compile threshold.
- Define a 1 minute warmup period, using the -XX:CompilerWarmupPeriodSeconds flag. We can then give the compiler more resources to do work in the warmup period using
-XX:CompilerTier2BudgetingWarmupCPUPercent=100. We therefore devote maximum resources to resolving the compilation workload before the health checks kick in. - Constrict the amount of CPU the JVM can use for compilation after the warmup period. We can either do this statically using thread counts via
-XX:CIMaxCompilerThreads, or dynamically as a percentage of available CPU, using the-XX:CompilerTier2BudgetingCPUPercentflag. - Further reduce the number of compilations done by filtering those methods that took way too long (e.g. over 1 minute) to reach our compile threshold, which by intuition means they are not “really hot.” We do this using the
-XX:TopTierCompileThresholdTriggerMillisflag.
Let’s take a look at each of these areas in detail and see the effects step-by-step.
Step 2: Compiling as soon as possible using ReadyNow
Once the JVM is started, time is ticking. The ultimate goal is to complete as many compilations as possible, ideally all, before the autoscaler starts monitoring. In order to do that, we start with utilizing ReadyNow, which accomplishes two things:
- Reduces the total amount of compilations, since the JVM already knows from the previous run which speculations were wrong, thus completely skipping it in the subsequent runs.
- Starts the compilations even before the methods are called. By starting them earlier, the JVM can finish them earlier.
Let’s see ReadyNow in action.
JVM flags used
-XX:ProfileLogIn=<path to ReadyNow profile> |
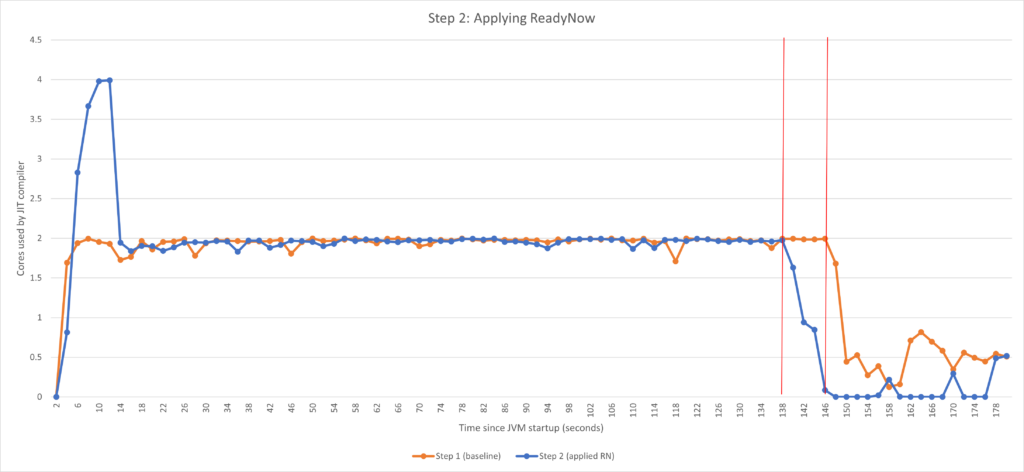
After applying ReadyNow, we see two things:
- The warmup period got shorter by ~10 seconds. The main reason is the two-times higher activity in the beginning of the run – we were able to get some work done earlier. When turning on Azul’s ReadyNow Java warmup feature, Azul Platform Prime by default adds two more threads to the pre-main phase for compilations – you can see exactly two more cores being utilized. Let’s be absolutely transparent – in this particular example, we aren’t actually able to see the real benefit of ReadyNow starting the compilations much earlier since this is a synthetic benchmark that does one thing over and over, rather than a real application that has distinct phases of execution. The benefit comes from default behavior of adding resources (which can be further adjusted via
-XX:ProfilePreMainTier2ExtraCompilerThreads). However, in general, using ReadyNow is essential to get the best possible behavior. - The post-warmup activity is noticeably lower. On the other hand, here we see ReadyNow in its full strength – the lower post-warmup activity comes from not doing compilation activity that we know from previous runs is not needed.
As a checkpoint, we were able to achieve a minor shortening of the warmup period and noticeably better post-warmup behavior. But, we’re very far from our 1-minute mark. Can we do better?
Steps 3-4: Adjusting available CPU during and post-warmup
Specifying the warmup period
Specifying the warmup period is essentially telling the JVM that there’s a time interval from the start of the JVM that it should treat specially. By treating it specially, we mean being able to set, for example, a different CPU limit for the JIT compiler. So, let’s set the warmup period to the time until the autoscaler turns on CPU monitoring. Up to that point, we try to use as much CPU as possible to compile as many methods as possible. However, once the warmup period is over, we limit the amount of available CPU to control the overhead and stay within the desired CPU limits.
To specify the period for which you want to dedicate extra CPU power toward compilations, use the following flag:
- -XX:CompilerWarmupPeriodSeconds – Defines how long the Falcon compiler warmup period shall be, in seconds. Default value is 0.
Having specified the warmup period, we can now adjust the available resources as discussed above. For that, let’s use a feature we built called CPU budgeting which allows us to limit the CPU resources at a very fine-grained level, even to the fractions of a core/hardware thread.
Controlling CPU spent by the JIT compiler
The most natural way of specifying the available CPU resources is by percents of total available CPU as a baseline. By “available CPU,” we mean the number of cores when running on bare metal. In containers with all the possible container limits, the math is slightly more complicated.
We can set the compiler CPU limits using the following options:
- -XX:+EnableTier2CompilerBudgeting – Enables CPU budgeting feature.
- -XX:CompilerTier2BudgetingCPUPercent – Specifies the amount of CPU, as a percent of total available CPU, which can be used for compilation in the post-warmup phase. The resulting value can be less than one core or any other non-whole number of cores. The Falcon compiler is then limited so that it does not consume more resources than the percentage indicated here.
- -XX:CompilerTier2BudgetingWarmupCPUPercent – Similar to the option above, specifies the amount of CPU which can be used for Falcon compilation, during the warmup period.
To give a specific simple example, a compiler CPU budget of 40% on a machine with eight cores allocates 3.2 cores to the Falcon compiler.
It’s time to see those flags in action.
Adding resources during warmup
Let’s first add more CPU for compiler during warmup. Let’s set the warmup period to 2 minutes (not 1, let’s get back to that later) and allow the compiler to use all the available CPU.
JVM flags
-XX:+EnableTier2CompilerBudgeting -XX:CompilerWarmupPeriodSeconds=120 -XX:CompilerTier2BudgetingWarmupCPUPercent=100 -XX:ProfileLogIn=<path to ReadyNow profile> |
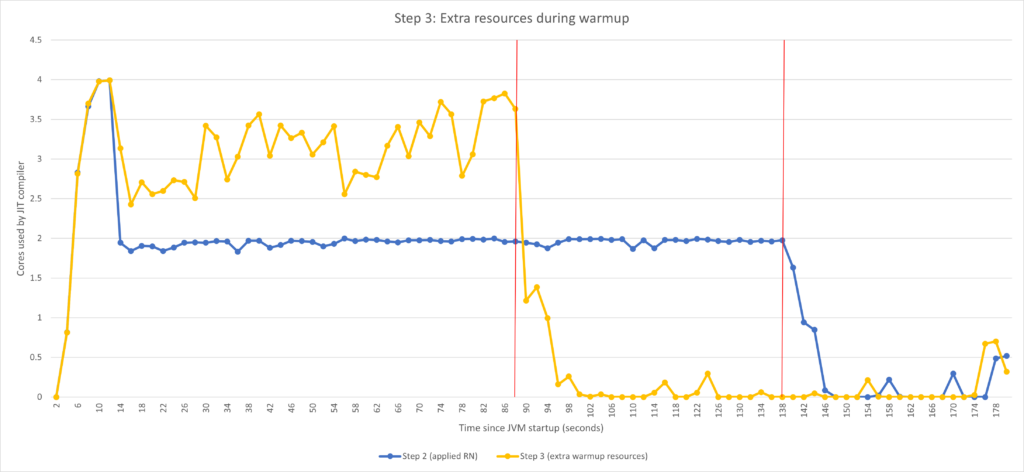
Using -XX:CompilerTier2BudgetingWarmupCPUPercent=100 , the Falcon compiler uses all the available CPU for the duration of the warmup period. This is in contrast with the default behavior where the heuristics wouldn’t assign that much CPU dedication to the Falcon compiler.
As you can see, the length of the warmup period is drastically reduced from ~140 seconds to ~90 seconds. Since we allowed more resources in the beginning of the run, the compiler was able to complete its work sooner. If the autoscaler had been configured to start monitoring after e.g. 100 seconds, our journey would have probably ended here. But that’s not the case.
Note: To explain the previous mention about why 2 minutes for warmup period – we knew that with additional resources, compiler will be able to do all the work in that period of time. I just wanted to demonstrate the effect of increasing the resources and that it still might not be enough – so I picked a large enough time window to complete all the work.
Limiting resources post-warmup
Given that the original goal is to control CPU utilization of compiler after 60 seconds, from the previous chart we still see that there’s a lot of activity that would cause the autoscaler to add machines unnecessarily. Therefore, let’s adjust also the post-warmup CPU utilization.
JVM flags
-XX:+EnableTier2CompilerBudgeting -XX:CompilerTier2BudgetingCPUPercent=33 -XX:CompilerWarmupPeriodSeconds=60 -XX:CompilerTier2BudgetingWarmupCPUPercent=100 -XX:ProfileLogIn=<path to ReadyNow profile> |
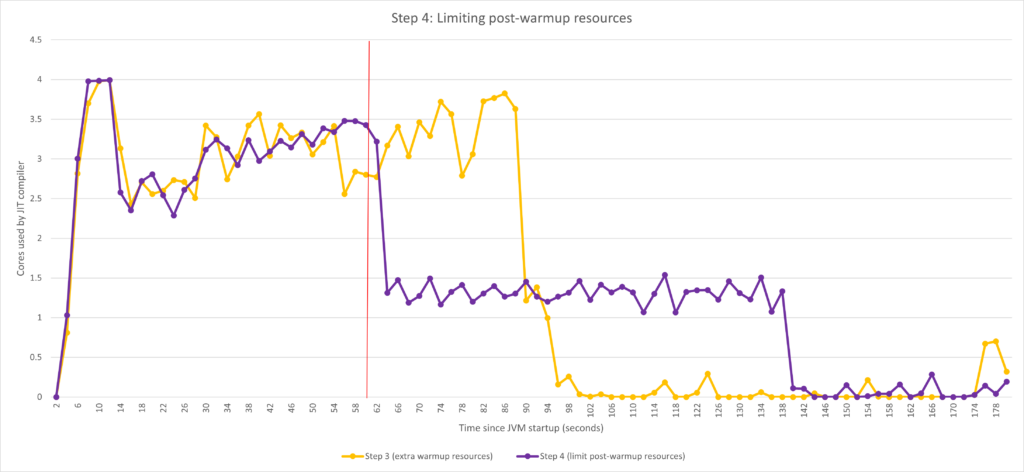
Once the warmup period is over, the compiler’s available CPU is limited by -XX:CompilerTier2BudgetingCPUPercent=33 which turns into much lower CPU utilization after the 60 second mark.
To scale, or not to scale, that is the question
Now is a good time to remind ourselves that this is a balancing act. The amount of compilations between steps 3 and 4 is the same, they are just spread across different times. You could argue that having the compilations done later would actually result in lower performance (compared to the best that you would eventually get to) for some time after the autoscaler starts monitoring. And you would be right! However, the question is how big the hit is and whether it’s worth it. Let’s elaborate.
Look at the above chart, keeping the 60-second mark when the autoscaler starts monitoring – consider a case where utilizing more than two cores by the JIT compiler would cause the total CPU utilization to go over the threshold, causing the autoscaler to want to scale out. For step 3 behavior, it would start autoscaling pretty much immediately after 60 seconds and later it would probably scale down. For step 4 configuration, it would not scale out at all, but continue operating with lower (compared to best possible) performance for some time.
We argue that, most of the time, it’s actually beneficial to avoid autoscaling, for two reasons:
- We must not forget that autoscaling typically includes a non-trivial performance hit due to e.g. rebalancing of data, establishing connections, etc. Not to mention increased infrastructure cost.
- It’s possible that the lower performance is actually “good enough” for some time and it only gets better. As you can see from the chart below, by 60 seconds, we’re done with ~75% of compilations. It’s reasonable to believe that you eventually get to “good enough for start” performance. Just to be clear, 75% of compilations done doesn’t mean 75% of the best performance, but this is another conversation.
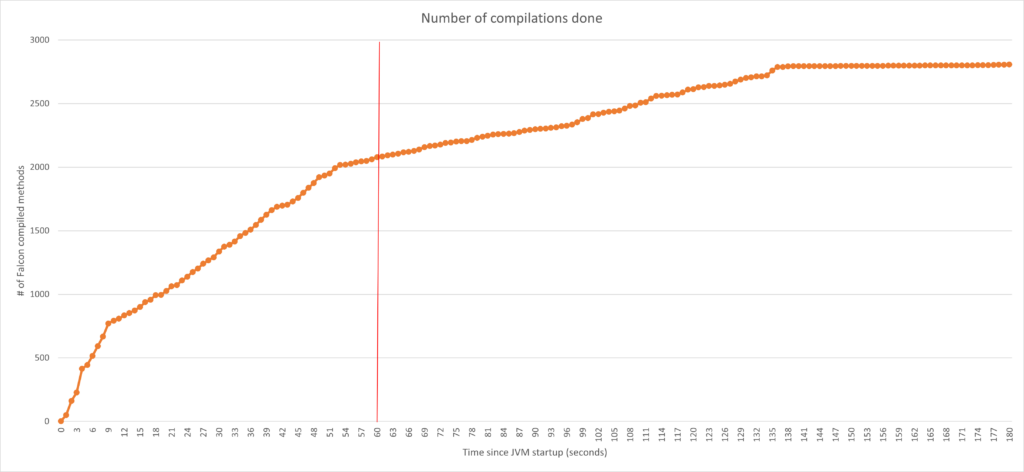
These aspects need to be tested and assessed for the specific applications. However, the big takeaway here is that with Azul Platform Prime, unlike any other JVM, you actually have the tools to choose. And from our experience, when used correctly, you can achieve drastically better behavior that not only saves you money, but also reduces unwanted effects of autoscaling (e.g. errors due to breaching SLAs).
To add a cherry on top, let’s try to polish the compilation activity slightly more.
Step 5: Further reducing the amount of compilations
Introduction to compile threshold
The JVM monitors each method and starts to build a profile which includes how many times a method has been called. The compile threshold defines how many times a method must be called before it is put to the Falcon compilation queue. This is an important factor in compiler optimizations theory since methods which aren’t used often don’t need to be optimized. We can save resources by focusing only on methods that are called often. The compile threshold is defined using -XX:FalconCompileThreshold which defines how many times a method (or loop within the method) must be called before putting the method to the compilation queue (by default 10,000). However, adjusting this threshold directly is very advanced tuning and is not recommended as a general practice. Let’s see another approach.
Compiling only actively hot methods
While compiling all methods which hit the compile threshold (which is the default behavior) is great for code optimization, it can still put an unnecessary burden on system resources. Imagine a method is called sporadically, but continuously through the life of the JVM. Due to the fact that it’s still being called with lower frequency, it reaches the threshold eventually and gets scheduled for compilation. However, we can argue that since this method is called sporadically, i.e. it’s not “hot,” it probably won’t have a noticeable impact on overall performance of the application. Thus, we can assume that compiling it with the full variety of Falcon optimization is just wasting resources.
For this reason, Azul has implemented an option in Optimizer Hub and Azul Platform Prime to tell the compiler to queue a method for compilation only if it has reached the compile threshold within a specified amount of time. This ensures that only “hot” methods, methods which are still being actively called, are scheduled for optimization. The time limit for reaching the compile threshold is specified using the following command line argument:
- -XX:TopTierCompileThresholdTriggerMillis – Tells the compiler to promote a method to the Falcon compiler queue when the compile threshold (specified by
FalconCompileThreshold) has been reached within the specified amount of time at least once. The value is in milliseconds. For example, settingTopTierCompileThresholdTriggerMillisto 60,000 specifies to queue the method to Falcon compiler queue only if the method has been called 10,000 times (default compile threshold) in the last minute (60,000 milliseconds).
JVM flags
-XX:TopTierCompileThresholdTriggerMillis=60000 -XX:+EnableTier2CompilerBudgeting -XX:CompilerTier2BudgetingCPUPercent=33 -XX:CompilerWarmupPeriodSeconds=120 -XX:CompilerTier2BudgetingWarmupCPUPercent=100 -XX:ProfileLogIn=<path to ReadyNow profile> |
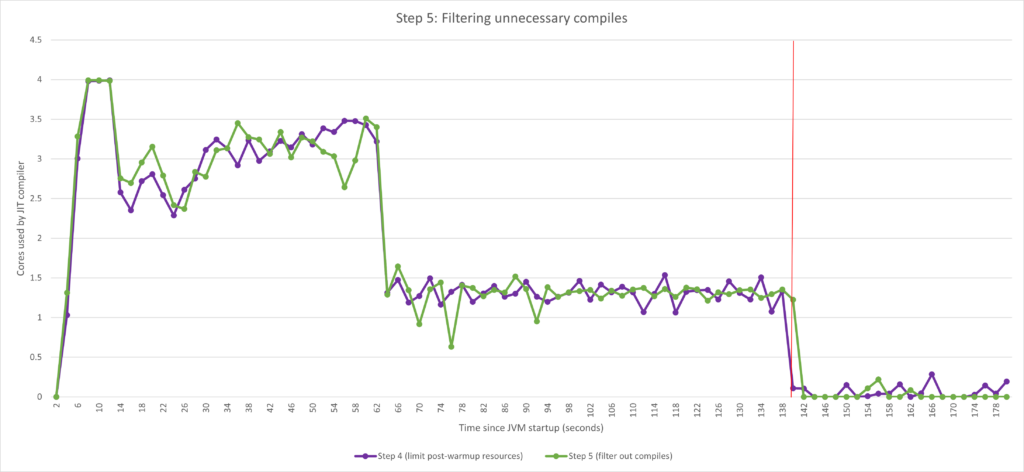
The effect of setting -XX:TopTierCompileThresholdTriggerMillis can be seen especially in reduction of CPU utilization of the JIT compiler later in the run. In the chart above, compare the number of spikes after ~140 seconds. This is most likely due to all of the important methods having been compiled by then and, by filtering out the not-so-hot methods, the compiler is doing less work.
It goes without saying that using this option is fine-tuning. If you set the time interval too low, the compiler might drop too many methods which impacts performance. In our experience, for real-world applications like Spring Boot-based microservices, the time threshold of 60 seconds is a good starting point.
Final comparison
To summarize, let’s look at the before and after pictures again.
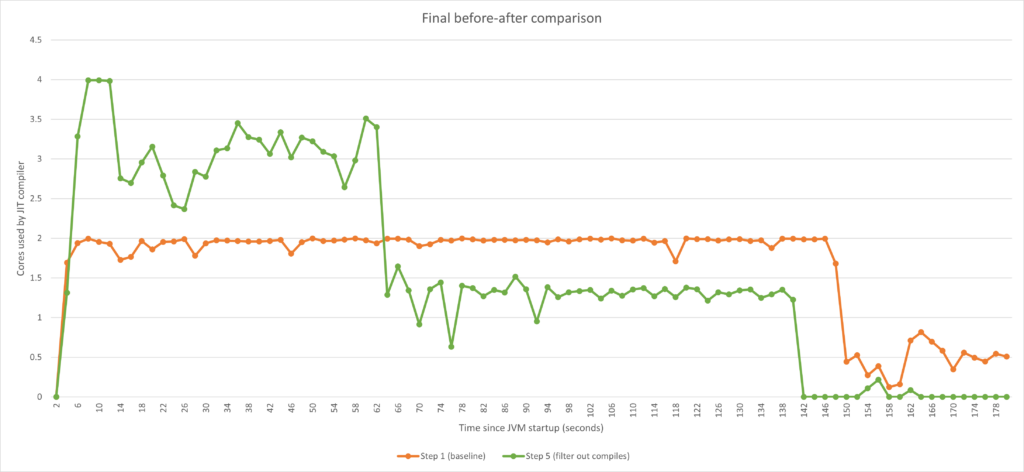
We can clearly see that after applying all of the tuning methods outlined here, we were able to closely control the compiler’s CPU utilization and optimize CPU load towards our goal of lowering it after 60 seconds. While trying to get away from unwanted scaling, we also improved the total warmup time, getting to the best performance sooner.
Try it yourself but don’t hesitate to reach out!
Azul Platform Prime is free to download and test in non-production. You’re welcome to try it out, but even more welcome to reach out to us. Azul Platform Prime is more than just shaping of CPU activity as shown in this post, but Azul Platform Prime can also deliver an extraordinary performance boost to your application, making your throughputs high, latencies low and getting your infrastructure costs under control.
Appendix A: Controlling CPU spent by compiler via thread counts
Controlling CPU resources by the JIT compiler has historically been done by adjusting thread counts (compared to CPU percent limit as shown in this post), so not mentioning these options felt incomplete. However, we chose to list the options not only for completeness. There’s a very specific use-case where adjusting the CPU resources via thread counts is preferable to CPU budgeting. That is when the JVM is running in a container and is set with CPU limits causing CPU throttling. This topic itself deserves a whole article, but without doubling the scope of this post, we can describe it briefly.
Delays (latency outliers) caused by CPU throttling are generally larger than scheduling delays (threads fighting over CPU time) due to the fact that throttling suspends all process threads, while scheduling delays suspends only a subset of the threads. In summary, if you experience significant CPU throttling, you may consider adjustments of resources via thread counts. If this topic sounds interesting, let us know and we can dig deeper.
Options which are used to control Falcon JIT compiler thread counts are:
- -XX:CIMaxCompilerThreads – Defines the number of CPU threads which can be dedicated to the compiler. This tells the compiler how many threads (as a maximum value) shall be used for compilation. The default value is dependent on the CPU count.
- -XX:CompilerWarmupExtraThreads – Allows the Falcon compiler to exceed the maximum number of threads during warmup. This option defines how many extra threads over
CIMaxCompilerThreadsthe Falcon compiler can use during warmup. After warmup, the value ofCIMaxCompilerThreadsshall be respected. The default value is 0. - -XX:ProfilePreMainTier2ExtraCompilerThreads – Defines how many extra threads over
CIMaxCompilerThreadsthe Falcon compiler can use beforemain()method is executed.


