
Every developer wants to make sure his application has enough headroom for startup and for peaks that happen as the application runs. Adding extra horsepower to an application’s deployment in a cloud environment can make sure the application runs optimally, but it can be very expensive. In this blog post, Azul Vice President of Developer Relations Pratik Patel examines overprovisioning Java resources. Fortunately, there are ways to reduce your need to overprovision, saving a significant amount of cloud spend. I’ll specifically look at overprovisioning in the context of Java applications.
Developers are strange animals; we will use a shiny new tool or library in an application without too much thought but are cautious when deploying to production. No one wants their pager to start buzzing in the middle of the night, not to mention the pressure to keep applications running at high 9s of reliability. Developers are adventurous when building and coding applications but very conservative on the operational elements.
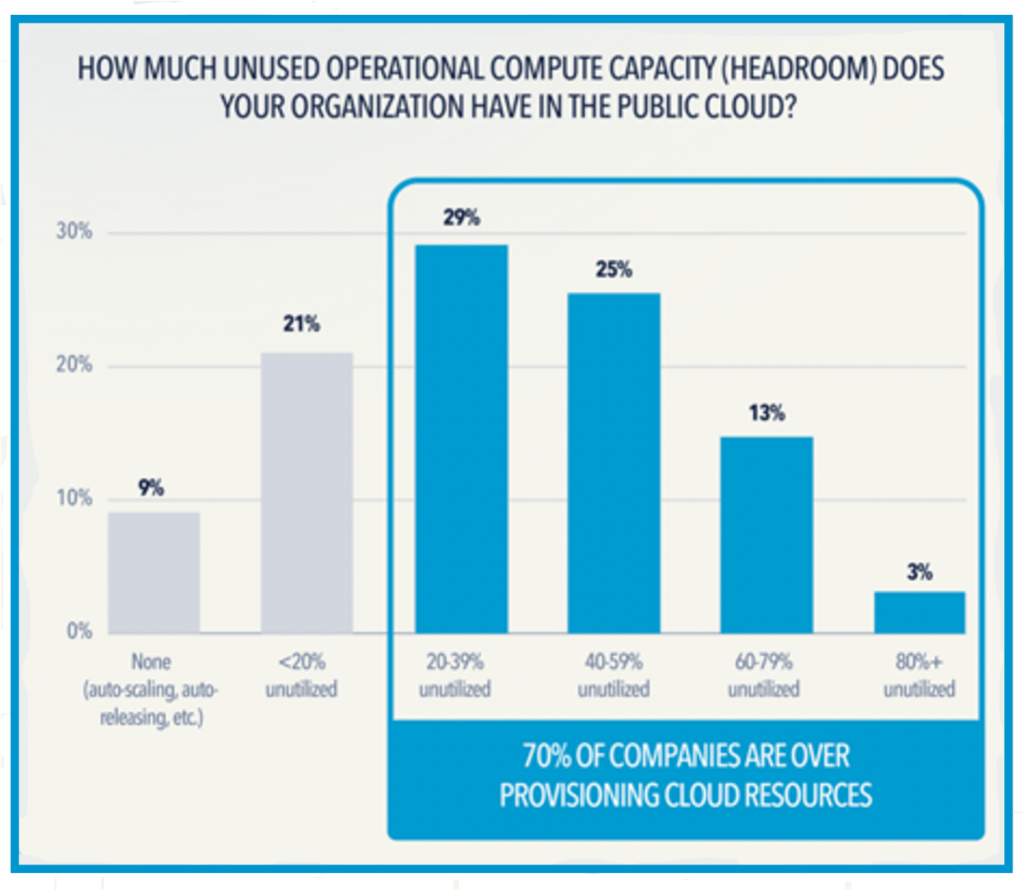
Enter a phenomenon called overprovisioning: adding extra horsepower (typically CPU and RAM) to an application’s deployment in a cloud environment to make sure the application has enough headroom for startup and for peaks that happen as the application runs.
Fortunately, there are ways to reduce your need to overprovision, thus saving a significant amount of cloud spend. I’ll specifically look at overprovisioning in the context of Java applications.
Application load Is never stable
As any developer or DevOps person will tell you, the traffic to an application is almost never uniform throughout the day or week, and the vast majority of apps have uneven load over time. Every application has low points where it’s not servicing many user requests or processing data, and peaks where application utilization is extremely high. These peaks are fine as long as the application’s instances aren’t pushed to the point where the app has issues such as:
- Exceptionally long latency in responses and not meeting service level agreements (SLAs).
- Overutilization of memory leads to garbage collector (GC) thrashing in the Java Virtual Machine (JVM).
- Lack of resources (CPU thread, file/network handles) leads to rejected incoming requests and inability to do processing.
The last two issues can make the application completely unresponsive and appear as if it is not doing any processing. During testing, developers note this upper bound and scale the number of CPU cores and memory needed. Then they add an often arbitrary amount of CPU and memory to accommodate for peaks — overprovisioning the application’s available resources. Overprovisioning is the development team’s safety net to ensure things are working smoothly and users are happy with the response time.
Millions of Java developers, hundreds of millions of devices, and the world’s most highly regarded businesses trust Azul’s Java platform to power their applications with exceptional capabilities, performance, security, value, and success.
However, overprovisioning Java resources adds significant cost to running an application. A running cloud VM typically has fixed CPU (core or virtual CPU) and memory and is not considered elastic. This means you’re paying for the capacity you’ve configured whether you are completely utilizing it or not. This extra headroom can be anywhere from 5% to 50% of your provisioned cloud compute, depending on how much extra capacity the development team thinks is needed to accommodate the peak.
To help you deal with overprovisioning and save money on cloud spend, you can use certain strategies, depending on whether you’re doing vertical or horizontal scaling. I’ll describe these two scaling models along with strategies for each. These strategies and techniques can be used whether you’re running in the cloud or on-premises.
Vertical scaling
Vertical scaling is the simpler strategy for scaling an application to handle more load, but it’s less flexible than horizontal scaling. Vertical scaling means adding more CPU cores and more memory to an application on a physical or virtual server (or adding faster or more SSD storage if your application is I/O intensive). Changing these things requires stopping and restarting an application, which is disruptive. But there is a way to reduce overprovisioning for this type of scaling.
Better load testing and estimation
Performance testing is considered the most difficult type of testing — it requires deep knowledge of the entire application and all connected services. Setting up a performance test environment is labor intensive, and keeping it up to date with the production environment’s characteristics is also a challenge. Generating load that mimics production along with having application data (both the size and shape of production data) requires thinking and effort to get it right.
Because of this, development teams often make some assumptions and take some shortcuts. This is fine but leads to overestimating and overprovisioning the size of the application’s production instances.
What can developers do to get better performance data to right-size their Java application? Here are the top three things you can do to determine the peak capacity requirements of your application.
1. Measure CPU and memory Utilization for the server and the JVM
Often, developers look only at the server’s (or VM’s) CPU and memory utilization to determine the amount of both needed to handle peak loads. Using tools that monitor these things within the JVM will help set these at the right level:
- JVM GC monitoring: This can help detect too little memory, which leads to high CPU utilization as the JVM gets into GC trash scenarios. This can also help detect where too much memory is allocated, causing long GC pauses which causes longer than expected latency. Reducing unneeded memory can also save money.
- JVM thread monitoring: This can help detect when you do not have enough CPU, which leads to long response times or unresponsiveness. This can help detect too many idle threads, and by reducing the number of cores allocated you can also save money.
2. New JVM versions offer better performance than older versions
In our tests from JDK 11 to 17 to 21, we see improvements in CPU usage with every release of the JVM. Of course, your application’s code may need some adjustment, especially if your application is based on a release older than Java 11.
There are also different GC algorithms that allow you to get more efficiency out of your cloud VM; however, this is highly dependent on your application’s memory utilization. For example, an application that does heavy data processing and transformation will have a different GC profile than one that is a RESTful application. You can check the Garbage Collector section of the Azul blog for more information.
3. Understand how the JVM works
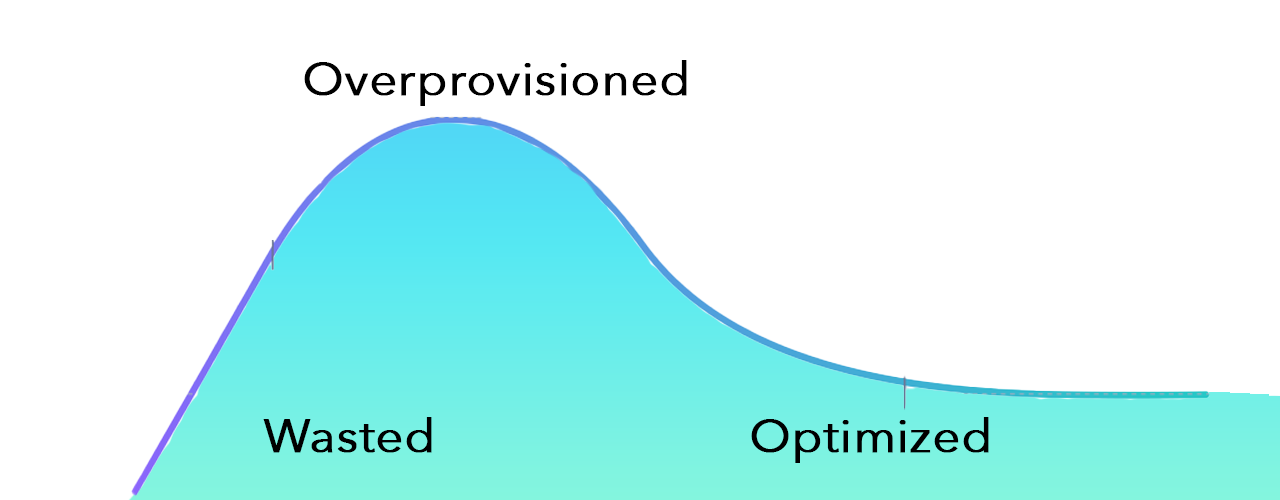
The diagram below shows how a typical Java application runs, from the startup of the JVM to how it executes over time. CPU usage is high on startup; this is the JVM starting up, loading classes, etc. Then your application framework (for example, Spring Boot) starts, initializes and reaches a “ready to serve requests” state.
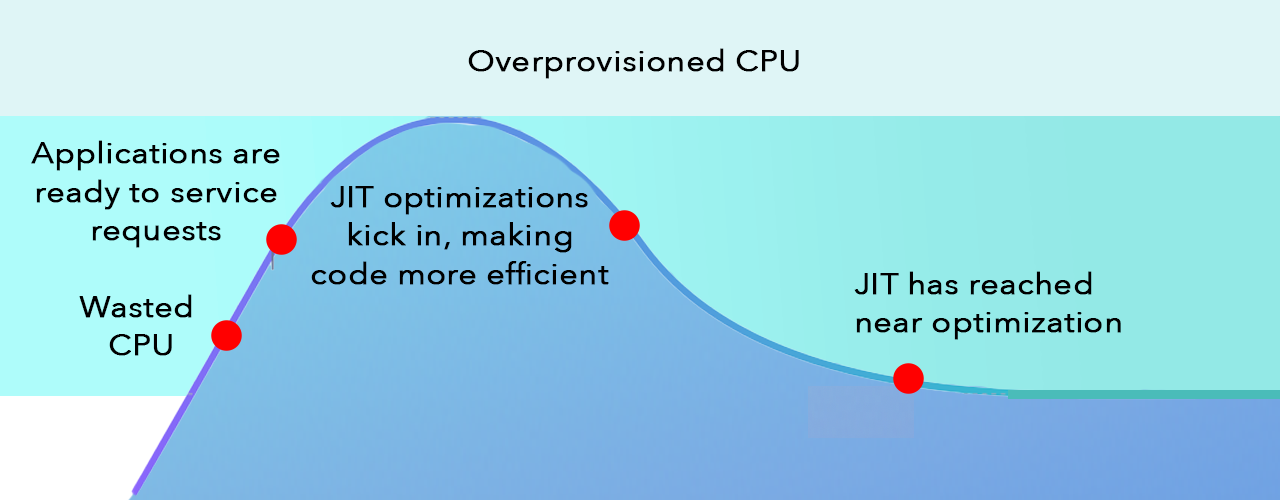
Notice the line above the peak that shows how much the CPU is overprovisioned for this application’s VM deployment (a safety net for bursty high loads.) As the JVM’s just-in-time (JIT) compiler optimizes the code pathways, the application gets more efficient — it uses less CPU to service the same amount of load. What ends up happening is, on top of the extra headroom you give the application, the JVM reaches a lower CPU utilization baseline because of the JIT compiler optimizations. Hence the amount of overprovisioning increases! This means you now have even more waste in allocated CPU — and a chance to save more money.
Using a high-performance JVM means you can reduce (or completely remove) overprovisioning. Understanding this curve and how it affects your application can help you reduce the safety net you allocate to your application’s VM instance. If you can bring down the top line (“overprovisioned”) once you know where the long-tail peak will be, you will be able to allocate less CPU cores and save on cloud spend.
Horizontal scaling
Elastic compute has been touted as the holy grail of scalable application development for many years, and horizontal scaling is the foundation of elastic computing. Horizontal scaling means adding capacity to an application by adding more servers (that have their own CPU and memory), rather than adding more CPU cores and memory to an existing server.
However, horizontal scaling is more complex and requires more planning and more external (to the application) setup than vertical scaling. And it is less efficient than vertical scaling, as you must introduce a routing layer, which means more processing and network overhead.
Reducing overprovisioning in a horizontal scaling deployment of a Java application is done by adding and removing capacity as needed, usually in an automated way that detects load and spins up or down application node instances. Hence, you will have some overprovisioned capacity, but a small amount, for a small amount of time (depending on how you’ve configured it).
Reduce the size of your application
As we have moved from architecting applications as monoliths to microservices (and even smaller cloud functions), we have made applications smaller and smaller. There are benefits and tradeoffs for these different architectures, but in the context of cloud cost optimizations for applications, specifically using horizontal scaling to get elastic computing smaller (or small to midsize) is best.
Reducing application size reduces the amount of CPU and memory you need to allocate to each instance of your application. This allows more incremental scaling and more efficient usage of resources, which in turn means more fine-grained control over cloud costs. The smaller the unit of deployment, the more (or less) you pay as you scale up and down. This of course is only possible if you are using autoscaling.
Use autoscaling
Autoscaling refers to an application’s ability to add or remove application instance nodes as load increases or decreases. With cloud cost optimization, we are interested in more aggressively scaling down, or stopping application instance nodes. Depending on the environment you use to build your application cluster, you get different options for autoscaling. The most popular autoscaling platform is Kubernetes, which supports autoscaling. The primary tradeoff with Kubernetes is that it introduces a high level of complexity to standard fixed-distributed-cluster deployments.
The simpler alternative to Kubernetes is Containers as a Service (CaaS), such as AWS Fargate, Google Cloud Run, or Microsoft Azure Containers. These deployment services offer a much easier way to deploy your application. You give your application in a Docker container to the service, and it handles autoscaling up and down. The tradeoff with CaaS solutions is that they cost more than standard VMs and possibly more than a managed Kubernetes deployment.
Conclusion
Reducing overprovisioning can help you save on cloud costs. Ultimately, what you can implement is heavily dependent on your application and its performance profile. Understanding what happens as applications start up and run is useful regardless of which strategy you use to reduce overprovisioning. Understanding the CPU and memory profile of Java applications will help you understand how your applications perform at runtime.
Consider using a more efficient high-performance JVM like Azul Platform Prime for small to large Java app deployments. Azul Platform Prime helps alleviate overprovisioning Java resources:
- Handles peak load better than other JVMs because of its advanced C4 GC, low-level optimizations and advanced Falcon JIT compiler.
- Can avoid the JIT ramp-up (and high JIT CPU utilization) with ReadyNow.
- Provides lower latency under load along with handling higher peaks because of how it handles peak load.

This article first appeared in The New Stack.


