 Read OpenJDK Migration for Dummies">
Appendix B
Optimizing the JVM
For Lower Latency, Higher Throughput, and Faster Warm-up
The Java Virtual Machine (JVM) is very powerful, providing an ideal managed runtime environment for robust, scalable, and secure enterprise applications. However, although the JVM is a great choice for reliably running some of the world’s most demanding workloads, the standard OpenJDK JVM is not
always a perfect choice.
During the last three decades, research on improving the JVM has focused on four areas: reducing latency, increasing throughput, achieving faster start-up/warm-up, and optimizing cloud workloads. There has been steady progress from release to release, and we’ve seen notable innovations over the years, summarized in this appendix.
Minimizing Latency with Garbage Collection
One of the top benefits of Java is automatic memory management. Memory management is a task that all programming languages must handle, and it’s also one of the most fundamental and error-prone aspects of software development.
Here’s how it commonly worked before Java. As a computer program ran, it allocated memory to store data assigned to particular variables. Then, at a certain point, that data was no longer used by the program. In languages like C++, programmers wrote (and continue to write) code that explicitly released this memory to ensure that there was enough memory available. In doing so, they prevented memory leaks — and potentially disastrous crashes — as well as dangling pointers and other memory-related bugs.
Concurrent Mark Sweep garbage collection
With Java, memory is released automatically through a process known as garbage collection. Java’s approach to memory management increases developer productivity and enhances the robustness and reliability of Java applications.
But there are trade-offs. Garbage collection algorithms that support high throughput can increase latency. Conversely, an algorithm that supports lower latency can affect throughput. Algorithms that are highly optimized for throughput or latency can increase an application’s memory footprint.
The first garbage collection algorithms required applications to pause as they did their work. This was necessary to ensure the safety of data, which could otherwise be left in an inconsistent state. Stop-the-world pauses could be very short and not noticeable to users, but some were long enough to introduce latency outliers and significant enough that applications failed to meet their requirements.
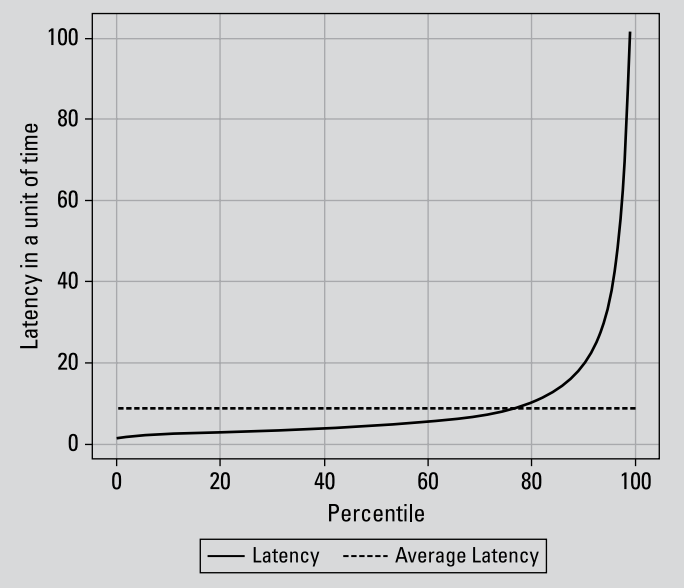
Understanding Long-Tail Latency
A challenge operations teams sometimes face in understanding latency is that the effect of averaging latency over time can be quite small. This is because extreme latency effects are “long-tail” effects. They occur less frequently than average latency effects but can still be devastating to a business. In the following figure, the y-axis represents an arbitrary unit of time correlating to an application’s latency. The
x-axis is the frequency of the latency effect for that unit of time by percentile. The dotted line is average latency for the entire application run. The solid line shows that latency is below average for more than 70 percent of the time that an application is running, but then latency spikes sharply in the upper 90th percentile.
To address this, the Concurrent Mark Sweep (CMS) garbage collector was introduced in 2001 as part of HotSpot JVM (JDK 1.4). CMS sought to minimize pause times by performing garbage collection concurrently with an application’s execution. By using multiple garbage collection threads, CMS aimed to reduce stopthe-world pauses
G1 Collector
JDK 9 replaced CMS with the G1 (Garbage-First) collector. G1 had several advantages, including its ability to:
» Deliver more predictable pause times by dividing the heap (the region of memory used for dynamic memory allocation) into smaller regions.
» Improve overall throughput by dynamically adjusting the duration of garbage collection cycles.
» Promote more efficient heap utilization by compacting regions concurrently.
» Support scalability with multithreading and parallelism.
» Reduce administrative overhead.
Shenandoah and Z Garbage Collector
Despite these improvements, however, latency remained a problem. Red Hat’s Shenandoah and Oracle’s Z Garbage Collector (ZGC) are alternatives to G1 that use additional concurrent and pauseless technologies to reduce pause times, even for applications with very large heaps. In addition to concurrent compaction, multithreading, and parallelism, they provide flexibility in heap sizing and use techniques such as load barriers, reference processing, and adaptive heuristics.
C4
Azul Platform Prime’s C4 Collector (for Continuously Concurrent Compacting Collector) is another advanced garbage collector. There are similarities between C4 and Shenandoah and ZGC, but C4 is designed to provide low-latency operations with high throughput while managing large heap sizes. Its emphasis on achieving pauseless operations leads to consistent low-latency behavior with no noticeable pauses even as applications scale to very large heap sizes — like multiple terabytes per JVM.
C4 uses a read barrier to support concurrent compaction, concurrent remapping, and concurrent incremental update tracing. With C4, enterprises can run two to five times more transactions through their infrastructure without pauses, jitters, or timeouts. From an operational perspective, engineers and developers spend less time tuning applications.
Increasing Throughput
Garbage collection algorithms can influence throughput. But other factors that affect throughput in Java applications have been the focus of sustained attention.
The problem of interpreting
In Java, source code is compiled into bytecode, which the JVM interprets at runtime. This system offers multiple advantages:
» It enables Java applications to be platform independent.
» It enables dynamic class loading at runtime.
» It provides higher degrees of security because the JVM is executing bytecode in a controlled environment.
However, interpreting bytecode — and then compiling it — is resource-intensive and slow. Interpreting at runtime can create a bottleneck that reduces throughput, particularly in computeintensive tasks or tight loops.
The JIT compiler
One way Java compensates for the slowness of the interpreter is with just in time (JIT) compilation, which produces faster code. The JIT compiler identifies frequently executed bytecode routines and compiles them into native machine code on the fly.
In OpenJDK, the JIT compiler is based on the HotSpot JVM (first released with JDK 1.3). Although the HotSpot compiler has been continuously improved and updated, companies like Azul, IBM, and Oracle have introduced even more highly optimized compilers.
Techniques like speculative optimization leverage profile information gathered at runtime to guide the JIT compiler. Statistical data identifies hot spots, optimizes frequently executed code paths, and eliminates unnecessary or infrequently used code branches.
Azul’s Falcon JIT Compiler
Azul’s Falcon JIT Compiler, a feature of Azul Platform Prime, uses advanced compilation techniques and optimizations to generate highly optimized native machine code, as well as specific optimizations that target applications running on Azul’s Platform Prime.
Among the features that set Falcon apart are the compiler’s memory optimization techniques. For example, Native Memory Tracking (NMT) tools provide extended information on how the JVM and the compiler use native memory.
As of Stable Release 23.02, an ergonomics heuristic based on the number of Falcon compiler threaders control when Falcon resets internal caches. Armed with information on native memory usage, engineers can also explicitly adjust cash reset behavior with the FalconContextReset flag. The more often caches are reset, the less memory is consumed.
Reducing Application Warm-up Times
Using advanced compilers and garbage collection algorithms can lead to a dramatic performance boost. Recent studies have found that enterprises that invest in Java optimization can expect to see two times the throughput on the same infrastructure and eliminate stop-the-world pauses.
Additional optimizations can also solve Java’s well-known startup and warm-up issues. These issues are one of the biggest challenges of using Java: Getting Java programs to run fast — by optimizing for high throughput and low latency — can take some time.
First, Java applications need to start up. This involves activities like class loading, initializing static variables, and setting up the runtime environment. After start-up, an application is ready to run, but it isn’t optimized for peak performance. That happens during warm-up.
During warm-up, a program runs with typical or representative workloads while the JIT compiler gathers profiling data. By collecting and analyzing the profiling information, the JIT compiler can dynamically recompile and optimize the code to improve execution speed and reduce interpretation overhead, as well as apply various other optimizations
Warm-up can take seconds to minutes or even longer. Factors that influence these times include the size and complexity of an application and a workload, the performance of the underlying hardware, and the efficiency of the JVM and its optimization strategies.
There are a few approaches you can take to shorten start-up and warm-up times.
Ahead of time compilation
Ahead of time (AOT) compilation involves converting Java instructions into native machine code ahead of execution so the application can be run as a stand-alone binary. Oracle’s GraalVM native image solution utilizes AOT.
AOT significantly reduces start-up time and eliminates warm-up time. It can also help reduce an application’s memory footprint. It’s useful for applications that start up frequently or have strict performance and memory requirements.
But AOT has several significant drawbacks. AOT-compiled applications can’t be optimized at runtime and will not (generally) benefit from the dynamism of the JDK. Perhaps most important, AOT-compiled applications can also be difficult to debug. Because AOT compilation is done in the development environment, which can differ significantly from the production environment, the ability to easily debug issues can be a nonstarter.
ReadyNow!
An alternative to AOT is to persist the profiling information gathered by the compiler so it doesn’t need to start from scratch with each subsequent run. With ReadyNow!, a feature of Azul Platform Prime, running an application generates a profile log that is consumed and updated with subsequent runs. Warm-up improves each application run until optimal performance is reached.
This approach ensures consistent, peak performance and is great for applications that must meet specific levels of service such as financial trading systems. It’s far superior to other workarounds for slow start-up and warm-up like using synthetic data or overprovisioning. Among additional benefits: Developers can get more control over Java compilation and can better manage runtime de-optimizations, which happen when compiled code doesn’t behave as expected and the JVM reverts to reinterpreting and recompiling the code.
ReadyNow! is a great choice for applications that are not required to start instantly and that have sufficient central processing unit (CPU) resources available to handle aggressive optimizations.
ReadyNow! performs two key functions:
- It gives operations teams the ability to save and reuse accumulated optimization profiles across runs.
- It provides a robust set of application programming interfaces (APIs) and compiler directives that give developers more control over the timing and impact of JVM de-optimization.
CRaC
Another way to achieve superfast start-up and warm-up using standard builds of OpenJDK is by using Coordinated Restore at Checkpoint (CRaC), which we discuss in Chapter 5. CRaC is a proposed feature of OpenJDK that allows a running application to pause, take a snapshot of its state, and restart later, including on a different machine or in another time zone.
CRaC is currently available in Azul Zulu Builds of OpenJDK 17 with CRaC support for Linux x86 and ARM architectures (64 bit). Amazon is also using the CRaC APIs in Amazon Web Services (AWS) Lambda SnapStart for Java functions. Frameworks like Micronaut, Quarkus, and Spring Boot also support CRaC or were planning to implement support at the time this book was published.
The main drawback to CRaC is its complexity. Compared to ReadyNow!, CRaC requires a higher level of Java expertise. You must make code changes in libraries, frameworks, and applications to coordinate resource management during checkpoint and restore events. ReadyNow! does not require such code changes.
Optimizing Cloud Workloads
In the last few years, the location where applications are typically deployed has shifted from local to cloud-based hosts. Instead of provisioning physical machines in a data center, users are switching to using public clouds. The utility-based pricing model can be much more cost-efficient — but not always.
Overprovisioning and resource waste
To gain the most benefit from the resource elasticity of a public cloud environment, monolithic applications are divided up into multiple container-based microservices. When a particular service becomes heavily loaded and introduces a performance bottleneck, more service instances can be started to balance the load and eliminate the bottleneck. As the load reduces, instances can be stopped — providing a dynamic architecture exceptionally well suited to minimizing cloud infrastructure costs.
But the scenario in which cloud resources are balanced against load can be challenging to achieve. Applications typically consume resources in spikes, and spikes can be notoriously difficult to predict.
As a result, companies routinely overprovision to ensure they’re prepared for unexpected increases in demand. A recent analysis by CAST AI found that, on average, 37 percent of the CPU resources
provisioned for cloud-native applications are never used (see CAST AI, “The State of Kubernetes Report: Overprovisioning in Real-Life Containerized Applications,” 2011).
And, when surveyed by Forrester Consulting, two out of three IT professionals attributed cloud waste to idle or unused resources and 59 percent to overprovisioning (see “HashiCorp 2022 State of Cloud Strategy Survey,” 2022).
Azul’s Cloud Native Compiler
Azul’s Cloud Native Compiler (CNC) is a centralized service that directly addresses certain aspects of overprovisioning. When bytecodes need to be compiled, they’re sent to the CNC along with the necessary profiling data to allow optimization.
This compiling method offers significant benefits for microservices architectures. When an instance of a microservice starts and warms up, the CNC compiles bytecodes for heavily used code and then caches the compiled code. When another instance of the same service is started, the CNC returns the code from its cache without the need for compilation. This reduces the time required for all subsequent invocations.
By moving the compiler’s work to the CNC, the JVM no longer must share its resources between the work of the application and compilation. This results in better performance during warm-up and eliminates the need to provision additional resources for a container that will be used only during warm-up.
You can do things like set higher CPU limits for horizontal scaling, and by using the JIT optimizations delivered by CNC, you can get more traffic through each JVM and provision fewer instances overall to meet your demand. You end up with benefits identical to those from highly optimized JVMs in more monolithic environments.
In a nutshell, faster Java code equals lower cloud costs. Instead of limiting utilization of your cloud instances, you can raise your threshold and still meet your performance service-level agreements (SLAs) using the techniques in this appendix.